
Beerlytics: Bar Density
#Recap#
Last week, I presented visualizations of beer-dense neighborhoods in twenty American cities. I encourage those who didn’t see my original post to check it out for an explanation of my methodology (which I’ve since realized may be similar to multivariate kernel density estimation?).
In my original approach, I considered all the locations RateBeer could tell me about, including beer stores and homebrew shops that were particularly good. This week, I’m paring back the set of locations I look at: if we only look at bars, brewpubs and restaurants, are our results the same? The question we’re looking into this week is subtly different from that of last week. My original graphs may have been better tailored to determining where to live to be surrounded by good beer, whereas the graphs I’ll present here may be more applicable to those just looking to go out and grab a pint or two or three. In addition to paring back the types of locations looked at, I also expanded my search area in each city, to make sure I wasn’t missing any high-density areas of sprawling cities like L.A.
Results
First, let’s compare how the rankings we presented last week have changed:
Previous Criteria
Considering all beer-related locations, we produced the following list of locations in our previous post:
- Philadelphia, PA: Thomas Jefferson University: 688
- Asheville, NC: Patton at Broadway: 610.8
- NY,NY: Bowery: 610.6
- Fort Collins, CO: 597
- Denver, CO: LODO: 488
- Brooklyn, NY: Williamsburg: 439
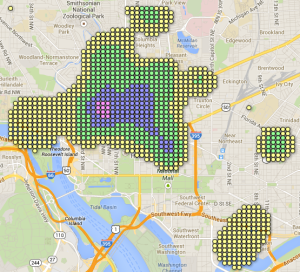
- Washington, DC: Dupont Circle: 428
- Washington, DC: Logan Circle: 419
- NY,NY: Flatiron District: 401
- Portland, ME: Downtown: 393
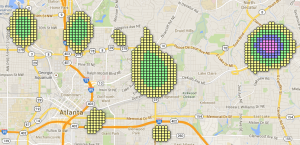
- Atlanta, GA: Decatur: 380
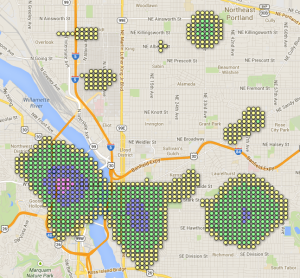
- Portland, OR: West Side: 379
- Washington, DC: Adams Morgan: 378
New Criteria
Only considering bars, brewpubs and restaurants, we get the following list of top neighborhoods:
- Philadelphia, PA: Thomas Jefferson University: 667
- Fort Collins, CO: 449
- NY,NY: Bowery: 409
- Denver, Colorado: LODO: 407
- Asheville, NC: Patton at Broadway 406
- NY,NY: Flatiron District: 393
- Atlanta, GA: Decatur: 388
- Brooklyn, NY: Williamsburg: 374
- Philadelphia, PA: Finn’s Landing: 353
- Portland, OR: West Side: 332
- Washington, DC: Dupont Circle: 332
- Portland, ME: Downtown: 327
- San Diego, CA: Northblock Lofts: 301
Discussion
Most neighborhoods have dropped quite a bit. Two of DC’s three salient neighborhoods have dropped of our radar, and Atlanta has climbed a few spots. There were two main surprises for me, though. First, Philadelphia has barely dropped at all. It’s so far out ahead of everyone else, it’s shocking. Second, I expected Fort Collins to drop as well, since I’m no longer counting the many breweries that beef up Fort Collins’ downtown. But, as a colleague reminded me, many of Fort Collins’ breweries double as killer brewpubs. And thus, Fort Collins is #2 in this analysis.
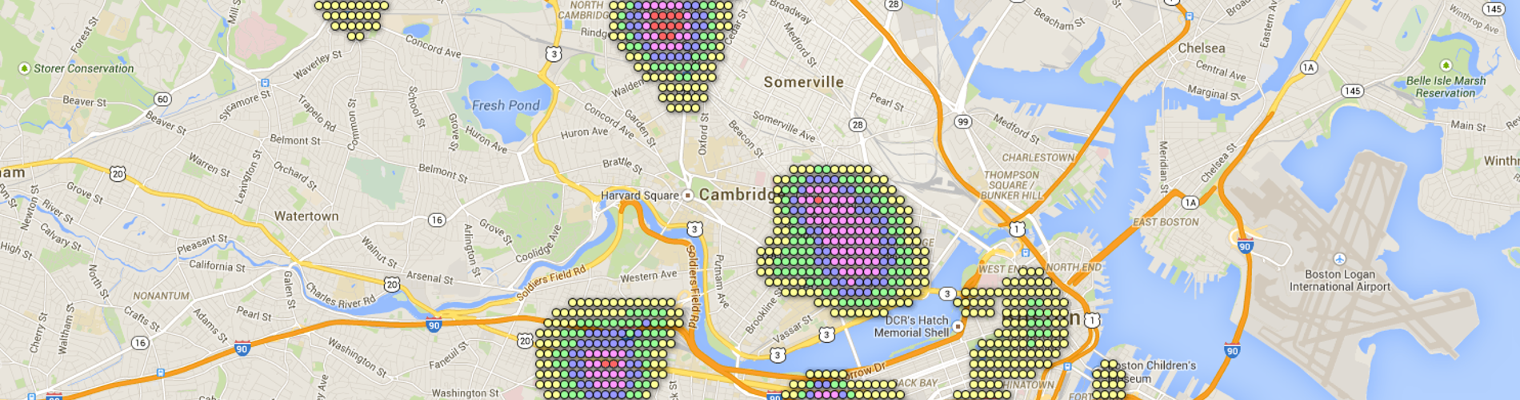
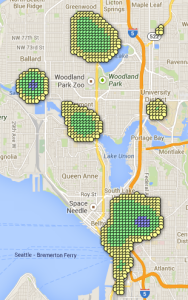
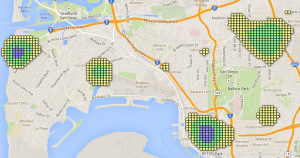
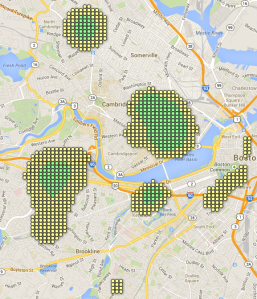
So yes, this changed between-city rankings. But within particular cities, did this effect interesting changes? I live in Boston. Let’s look at Boston! Here’s Boston’s new map, using within-city color scaling. Click on the map for the interactive version (same with all the images in this post)
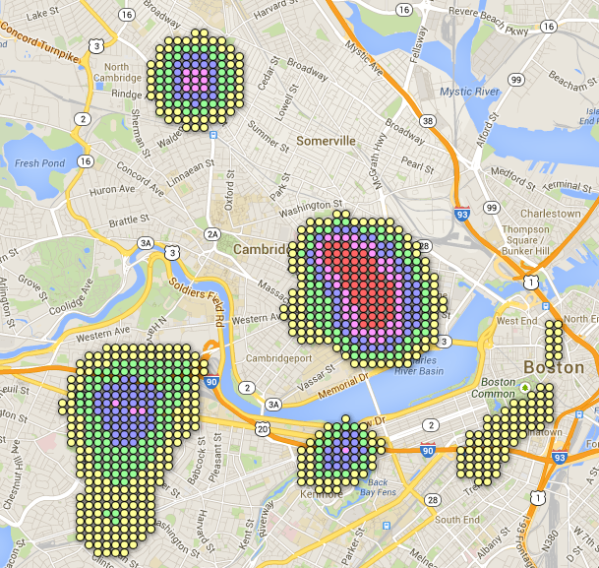
If you compare this to last week, you’ll see that Davis Square (the neighborhood to the north) is no longer the beery center of Boston, which is instead now found in Cambridge. This matches the expectations we previously had: Cambridge has much better beer bars, Medford has much better beer shops.
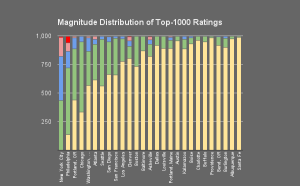
I also thought it’d be interesting to look at how cities compared as a whole: if you sum up the scores of the top 1000 locations for each city, you can assign it a city-wide score.
- NY, NY: 224,109
The City That Never Sleeps (because there are too many options) - Philadelphia, PA: 182,093
The City of Beerily Love - Portland, OR: 124,470
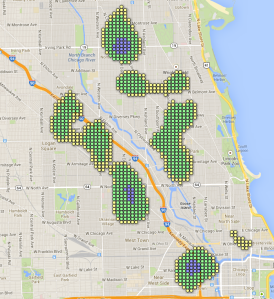
Beervana. No really, [that's what it's called](http://en.wikipedia.org/wiki/Nicknames_of_Portland,_Oregon#Beervana) - Chicago, IL: 119,740
Second (bar this block) City - Washington, DC: 111,581
Chocolate (stout) City - Atlanta, GA: 104,684
Hoplanta - Seattle, WA: 103,337
The City of Goodbeer - San Diego, CA: 101,266
San Diego's nickname is "America's Finest City." I'm not even going to dignify that with a parody. - San Francisco, CA: 90,388
The City That Knows How (to beer it up, apparently) - Los Angeles, CA: 86,866
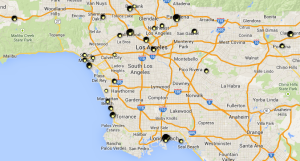
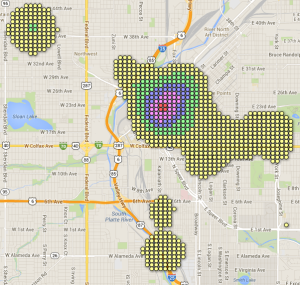
Look at LA's map. Can you see why it doesn't have peaks like Philly or DC? Everything's so spread out. Worst. Crawl. City. Ever. - Denver, CO: 85,938
I'd like to go to Denver. - Boston, MA: 82,527
I live in Boston, it's awesome. So much science! - Baltimore, MD: 63,851
Everything I know about the parts of Baltimore that are not the waterfront area, I learned from The Wire.
This gives a metric for the amount of beer-friendly space in a city, although obviously this is going to have a mild correlation with the size of the city, as seen below.
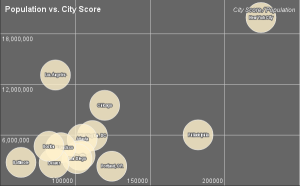
That being said, Portland,OR has the lowest population of the top 13, but has the third highest city score, and overall this may still be a useful way to think about what cities are most likely to provide you a reliable source of craft beer goodness. I think it helps get at what we see in the stacked bar chart: yes, Philadelphia has that downtown beer Mecca. But over half of New York City’s top-1000 spots are blue or better; it still has a lot of good beer but its spread out a little more (although not so much as in, e.g., Los Angeles).
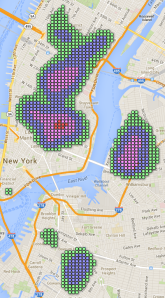
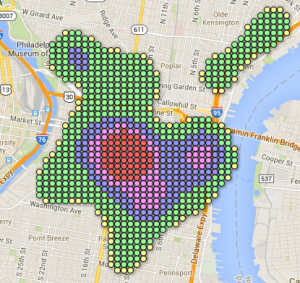
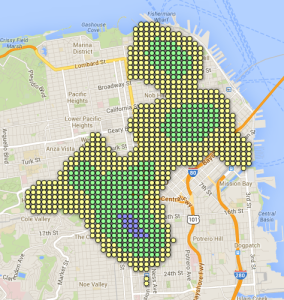
Finally, here is a list of maps for those cities we examined that have not yet been linked to in this article (some of which are locations requested by readers).


Leave a Comment